My OT security coursework modelled water-level control with a PLC, virtual tank sensor and valve actuator, an HMI/SCADA layer, and supporting virtual network infrastructure. I inventoried the assets, drew a segmented network design, reviewed its weaknesses and worked through firewall and monitoring lab steps. It was a simulated exercise, not work on a real industrial plant.
The two original network-design reports describe an intended architecture; they are not deployment records. The five published lab screenshots show selected pfSense, connectivity and Suricata views. They do not establish that every proposed component was integrated, that a firewall blocked the observed pings, or that Suricata detected an intrusion. Read the evidence and limitations notes ↗
Start with what the process needs to keep doing.
The report's OT inventory places OpenPLC Runtime at the water-flow control point, with Factory I/O representing the tank-level sensor and valve actuator. It also lists a Factory I/O HMI for operator interaction and an Ignition SCADA VM for supervisory monitoring. The supporting IT inventory includes pfSense, Wireshark, a Kali testing VM, Hyper-V virtual switches and a shared host; Suricata appears as the proposed monitoring component. Those are inventory and design statements. The published captures do not prove that the complete PLC-to-HMI process ran end to end.
A tank-level signal, PLC decision and valve command form a safety-relevant control loop even in simulation. My risk review therefore treated the PLC and operator view as high-consequence points: losing visibility or unintentionally interrupting a control path can matter as much as stopping an unwanted connection. The report assigns simple risk levels, but it does not include a quantitative hazard analysis or measured process impact.
Separate operations from field control without pretending the diagram is a deployment.
I proposed an operations-level network (192.168.2.0/24) for the HMI, security-testing access and supervisory functions, and a field-level network (192.168.1.0/24) for the PLC and Factory I/O devices. The reports place pfSense between those virtual switches so traffic crossing zones has a policy point. They place the virtual machines on a Hyper-V host and propose Suricata monitoring. The trust boundary is the important idea: an operations-side endpoint should not reach every field-side service merely because the networks are connected.
The design has clear limitations. One physical host and its virtual switches create a shared failure domain. Virtual separation is not physical isolation. The report itself notes that pfSense rules did not comprehensively restrict internal threats, while monitoring depends on correct placement and maintained rules. I recommended stricter inter-zone allowlisting, stronger segmentation, backup and recovery planning, and IDS tuning. Those are recommendations, not controls shown as completed.
Inspect the effective policy, not just the rule names.
The original pfSense capture shows rules on the LANLEVEL1 interface. Visible entries include a broad IPv4 pass from 192.168.1.0/24 toward 192.168.2.0/24 with wildcard protocol and ports, plus more specific TCP entries labelled for Modbus on port 502, SSH on port 22 and a service on port 8080. The page also shows a bogon-network block. This is evidence that those entries were present in the interface at capture time, not proof of the policy's end-to-end effect.
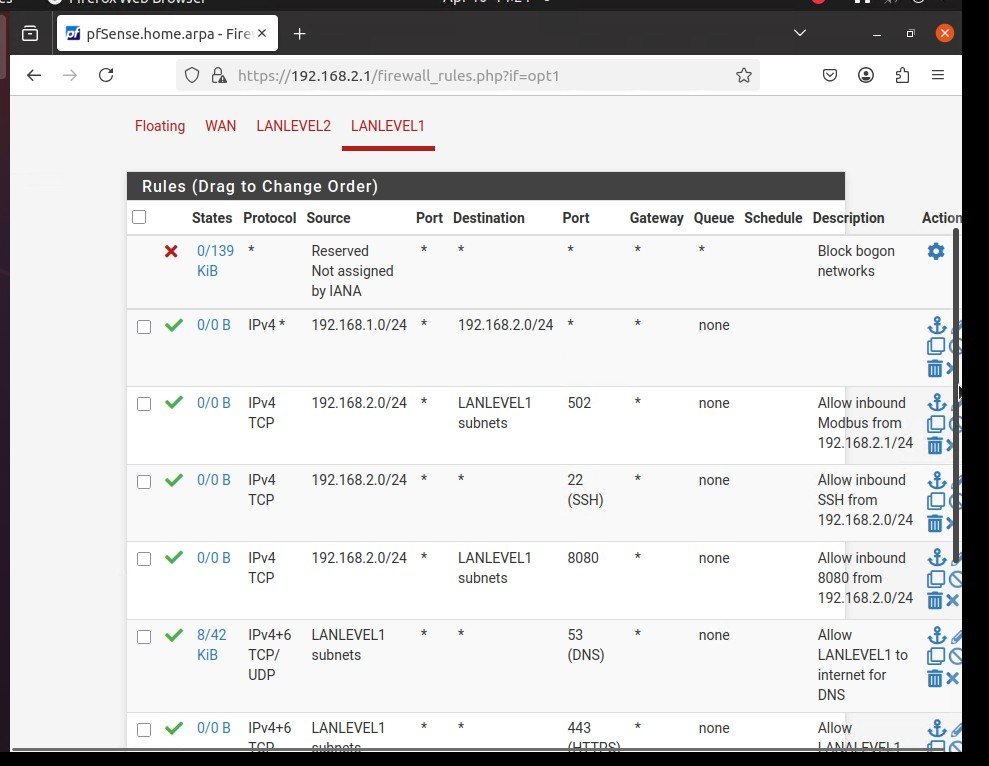
For a more defensible OT policy, I would first document the exact initiator, destination, port and direction needed for each process function, then remove redundant broad permissions only after confirming the control loop and operator access still work. The reports recommend tighter rules; the available images do not show that redesign completed or a complete rule-order review.
An unreachable host is an observation, not a firewall verdict.
The Ubuntu terminal capture shows pings from 192.168.2.5 toward 192.168.1.6 and 192.168.1.5. Both attempts returned “Destination Host Unreachable” with no received replies. That establishes failed reachability in this test. It does not identify the cause: addressing, routing, host state, interface configuration, ICMP handling or firewall policy would need separate checks. The screenshot contains no successful permitted-flow test, firewall log entry or packet trace tying the failure to a particular pfSense rule.
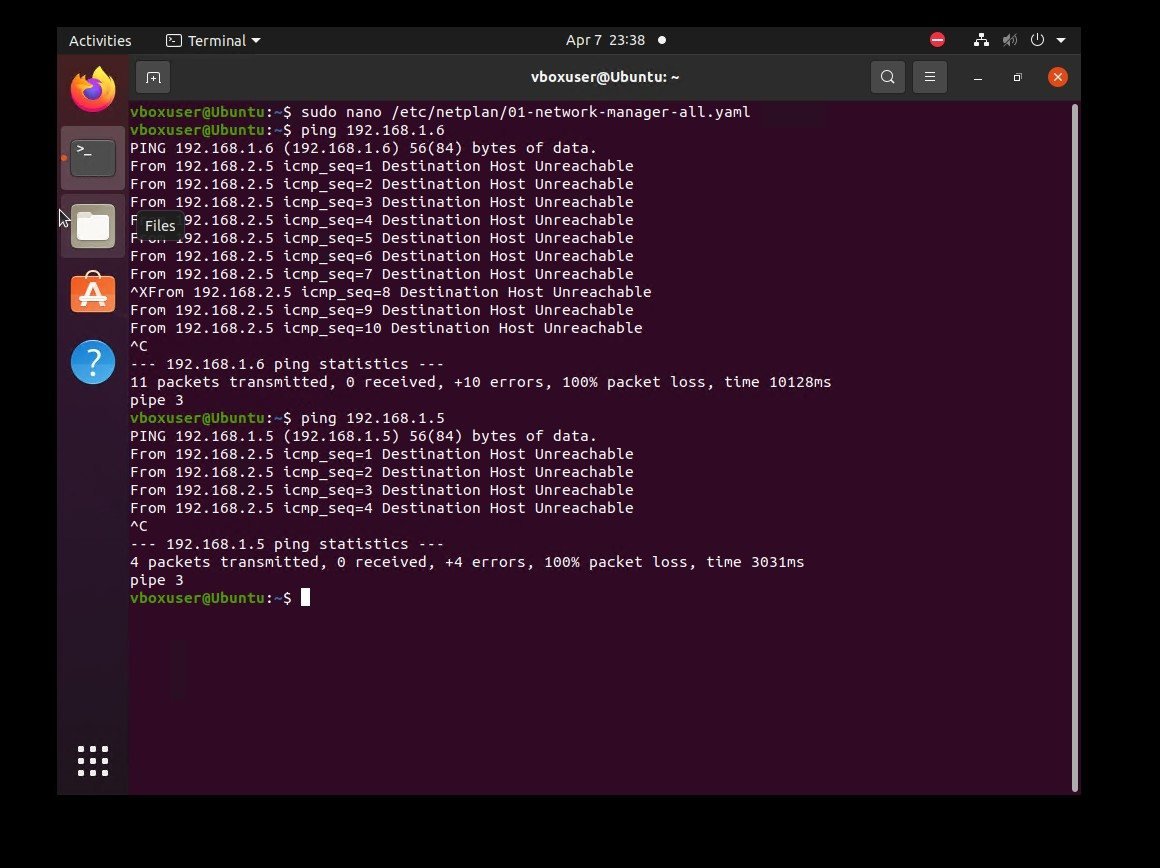
A stronger verification would record both an allowed and denied flow, host interface and route state, pfSense rule counters or logs, and a packet capture at the boundary. That would distinguish a policy decision from a broken path without risking a real process interruption. Those checks are proposed follow-up, not tests documented in the supplied evidence.
Configuration, validation and service state are three different claims.
The Suricata configuration image shows af-packet capture settings in suricata.yaml, with interface eth0. A second terminal image shows rules being loaded and a suricata -T test completing. A third shows suricata.service active after a restart. Together, they support that an Ubuntu Suricata instance was configured, its ruleset test completed and the service started. They do not show traffic from both OT zones arriving at that interface or an alert from an attack.
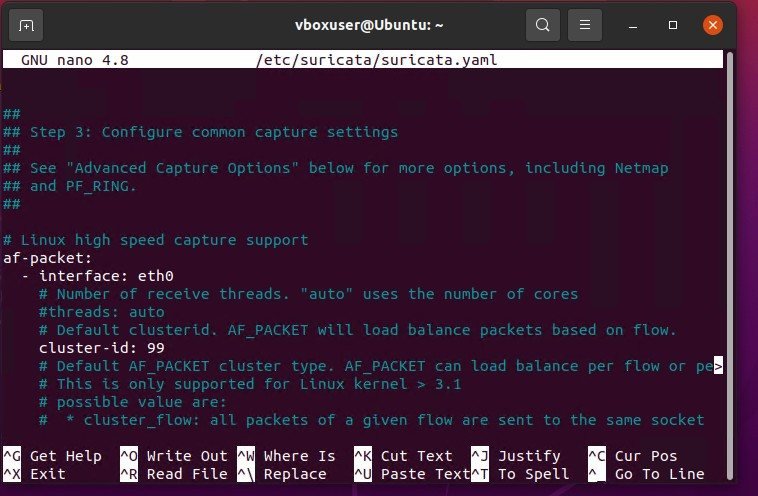
suricata.yaml. The selected capture interface is visible; placement and packet visibility are not. Open at full resolution.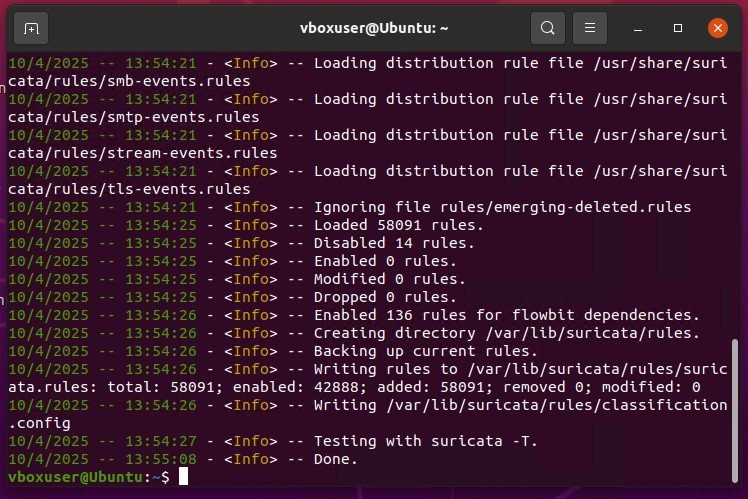
suricata -T finishes. These are configuration facts, not alert counts or detection results. Open at full resolution.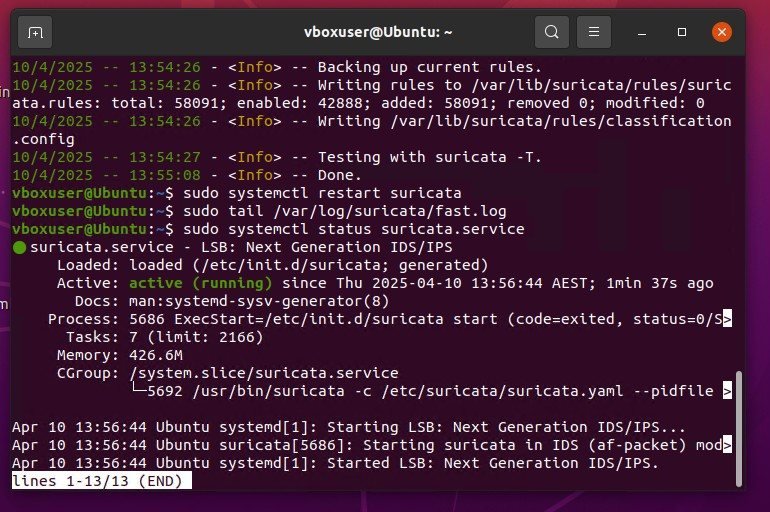
systemctl status reports the service active. No alert log or confirmed intrusion appears. Open at full resolution.The reports place monitoring on a proposed VM attached to the OT design, but the terminal captures identify an Ubuntu vboxuser session. They do not demonstrate that this pictured instance was the same VM as the report's Hyper-V monitoring node or that it saw both switches. Visibility would require evidence of the network attachment or mirrored traffic as well as representative packets and alert outputs.
Modbus/TCP is a specific flow to justify, not a reason to open the whole zone.
The pfSense screenshot labels a TCP 502 entry as Modbus-related. In the proposed control system, a legitimate controller-to-operator exchange must remain available; a rule should match the actual endpoints and direction after those are verified. The visible broad inter-zone pass rule is a useful lesson here: service-specific labels can give a false impression of least privilege if a wider entry is also present. The source does not show a successful Modbus session, a blocked Modbus probe, or measured control-loop behaviour after rule changes.
This is where OT differs from a conventional office network. Restricting paths can reduce exposure, but an untested change can interrupt a process or remove operator visibility. I would stage policy changes, define a rollback path, and validate normal operations alongside negative security tests. The source reports do not document a completed safety or availability test plan.
A network diagram is the start of an OT security argument.
Inventorying the PLC, virtual I/O, HMI, firewall, monitoring VM and shared host made the trust boundaries and failure points visible. The lab images then showed me how much evidence is needed to move from “configured” to “working”: a rule screen is not a traffic result, an unreachable ping is not a firewall log, and a running IDS is not a detection. That distinction is the most valuable part of this project.
The next iteration would tie the proposed topology to actual interface mappings, verify one necessary permitted control flow and one denied cross-zone flow, and capture Suricata seeing representative traffic. It would also document recovery and the operational effect of a firewall or host failure. These are future improvements, not outcomes of this coursework.
Sources: OT_Security_Network_Report_Final.docx, OT_Security_Network_Report_BenjaminRutt.docx, and five existing original OT lab captures. The full reports remain private. Evidence and limitations ↗